Price volume mix analysis
Price volume mix analysis (PVM) answers the question every finance review starts with: why did revenue change? Between a baseline period and a current period, it splits the total change into effects that can each be owned and acted upon.
The five effects
- Price effect — what changed because you sold at different prices. Valued at current volumes: for each product sold in both periods, the price change times the units sold today.
- Volume effect — what changed because you sold more or fewer units overall, valued at the baseline average price.
- Mix effect — what changed because the composition of your sales shifted toward cheaper or more expensive products, even at constant prices.
- New products — revenue from products that had no sales in the baseline period.
- Discontinued — revenue lost from products you stopped selling.
The reconciliation test
The five effects must add up exactly to the observed revenue change. That identity is algebraic — when it does not hold, something is wrong with the data or the method, and a serious tool says so rather than presenting a bridge that merely looks right. Every bridge built here displays its reconciliation status, to the cent.
Reading the bridge
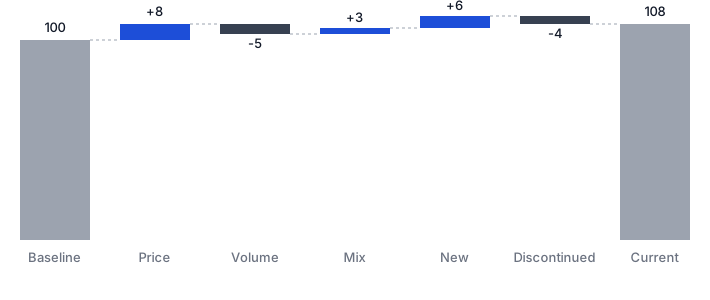
Start from the baseline bar and walk right: here, price added 8, volume took away 5, mix added 3, new products brought 6 and discontinued ones cost 4 — landing exactly on the current revenue of 108. A quick two-product example shows how the effects separate: sell 100 units at 10.00 and 50 units at 20.00 in the baseline, then raise the second price to 21.00 and sell 60 of it. The price effect is 60 × 1.00 = 60; the remaining change comes from volume and mix, not from price. That separation — not the totals — is what the bridge is for.
Breaking effects down further
Two of these five effects can be split into finer parts when your data supports it, and each split still adds up exactly to the effect it refines — so the bridge still reconciles to the cent. The mix effect divides into a category mix (volume shifting between whole categories) and a within-category mix (shifting between products inside a category) as soon as you map product categories. And if you provide your gross revenue alongside net, the price effect divides into a gross price effect and a discount effect, isolating how much of the change came from list prices versus discounts. That is why a bridge built from a rich file can show more than five bars.
How analysts run it today
Most teams maintain a spreadsheet template. It works until it doesn't: new and discontinued products break the formulas, a few thousand SKUs make it crawl, and each close means an hour of careful copy-pasting. Purpose-built tools solve that, but sending detailed sales data to a third-party server is exactly what most company policies forbid.
Build yours in 60 seconds
This tool runs the whole analysis inside your browser — nothing is uploaded, which you can verify yourself. Drop a CSV or Excel export with a period, product, quantity and revenue column, map the columns, and read your bridge: waterfall chart, drill-down by category down to SKU, top movers, Excel and PNG exports.
Build your bridge — free, runs in your browser
Related reading: what a revenue bridge is · extending the bridge to gross margin